Data Engineering
Warehouses, lakes and pipelines that collect and transform data reliably.
Turn raw data into decisions. We build robust data infrastructure and deliver analytics and dashboards that help your whole organisation act faster and smarter.

Data is your most valuable asset, but only when it is clean, organised and actionable. Innovix GlobalTech builds robust data infrastructure and extracts meaningful insights through analytics and data science.
Our team designs scalable pipelines, builds business intelligence dashboards and applies statistical modelling and machine learning to support faster, smarter decisions.
We consolidate data from scattered sources into one trusted view, presented through dashboards that everyone can use.
The foundations and analytics your decisions depend on.
Warehouses, lakes and pipelines that collect and transform data reliably.
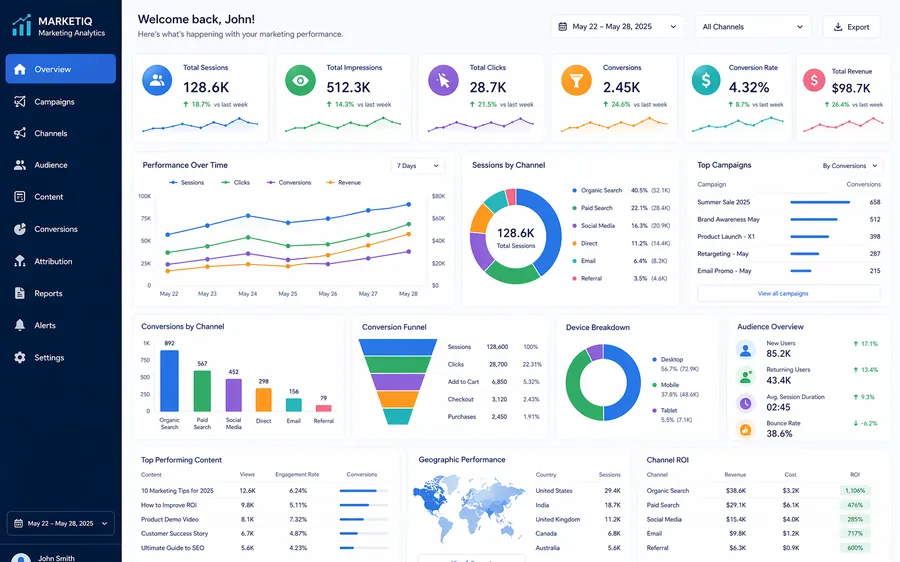
Interactive dashboards in Power BI, Tableau or Looker Studio.
Statistical and predictive models that forecast trends and spot opportunities.
Spark, Kafka and cloud services for large and real-time data.
Validation, lineage and access controls for data you can trust.
Combine ERP, CRM, marketing and operational data into one view.
A clear, collaborative process with regular check-ins so you always know what comes next.
Sources, questions and KPIs.
Warehouse and pipeline design.
Pipelines, models and quality checks.
Dashboards and reports for each team.
New sources, models and insights.
Consistent numbers across departments, from a single trusted source.
Live dashboards replace manual reports that take days to compile.
Analytics reveals trends, risks and savings you might otherwise miss.
We take full ownership of a defined scope, from requirements to launch.
Experienced specialists who join your team part-time or full-time.
Keep your systems secure, up to date and performing well.
Can’t find your answer? Our team is happy to help.
Power BI, Tableau and Looker Studio are all strong options. We recommend one based on your existing tools, users and budget.
Yes. We build pipelines that bring together data from ERP, CRM, e-commerce, marketing and spreadsheets.
If you report across several systems or large data volumes, a warehouse makes reporting faster and more reliable. We can advise during discovery.
Yes. Depending on your sources, dashboards can refresh on a schedule or stream data in near real time.
Automated validation, reconciliation checks and clear data definitions are built into every pipeline.
Tell us about your requirements. Our team will get back to you within 24 hours with clear next steps.